Example
Scatter Plot
A researcher wishes to determine whether the number of hours a person jogs per week is related to the person’s age
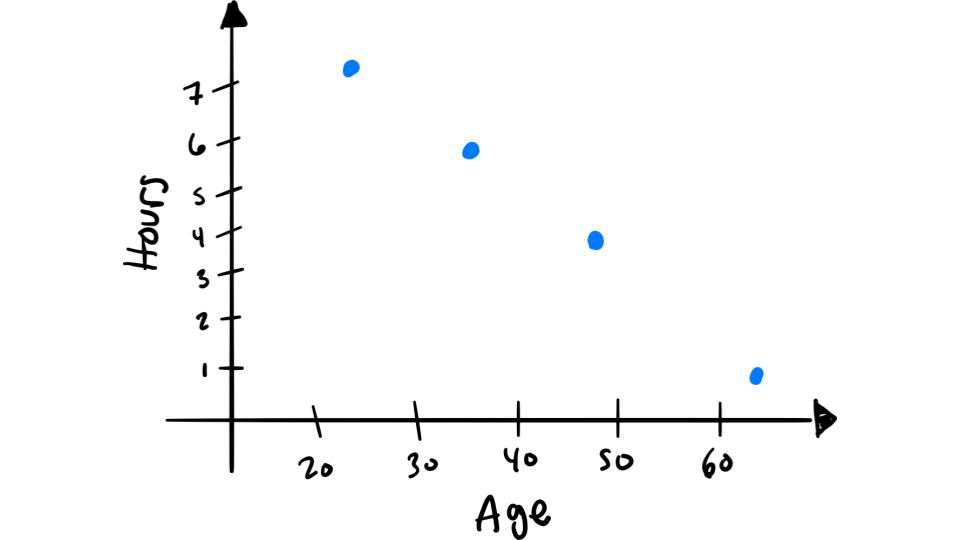
| Age (\(x\)) | 34 | 22 | 48 | 56 | 62 |
| Hours (\(y\)) | 5.5 | 7 | 3.5 | 3 | 1 |
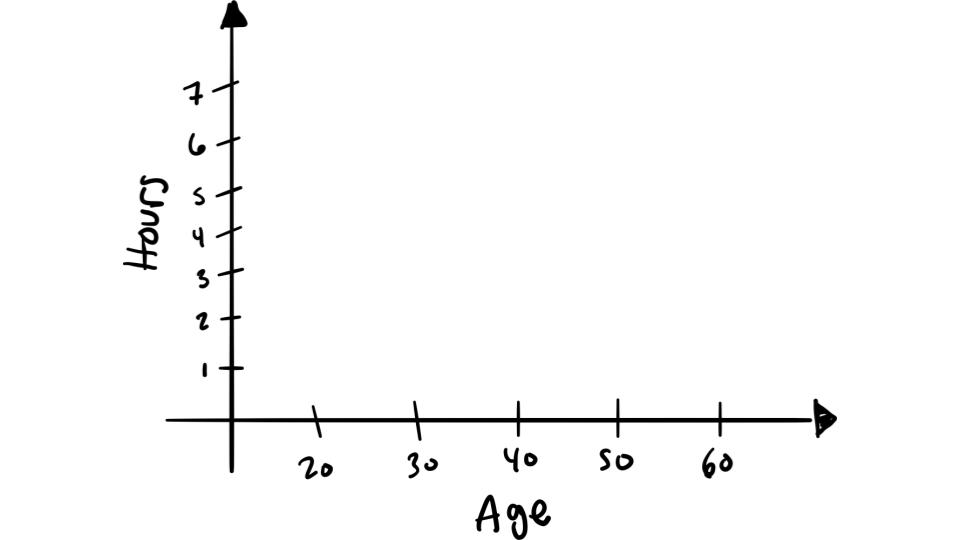
Step 1: Draw and label the \(x\) and \(y\) axes

Step 2: Plot the points for pairs of data

To see this done watch the following video: